
A tour of the pages
في هذه الصفحة
Every page of Signal Console, in the order of the side navigation: first the pages of what the hosts recorded, then the pages about Signal itself.
Overview
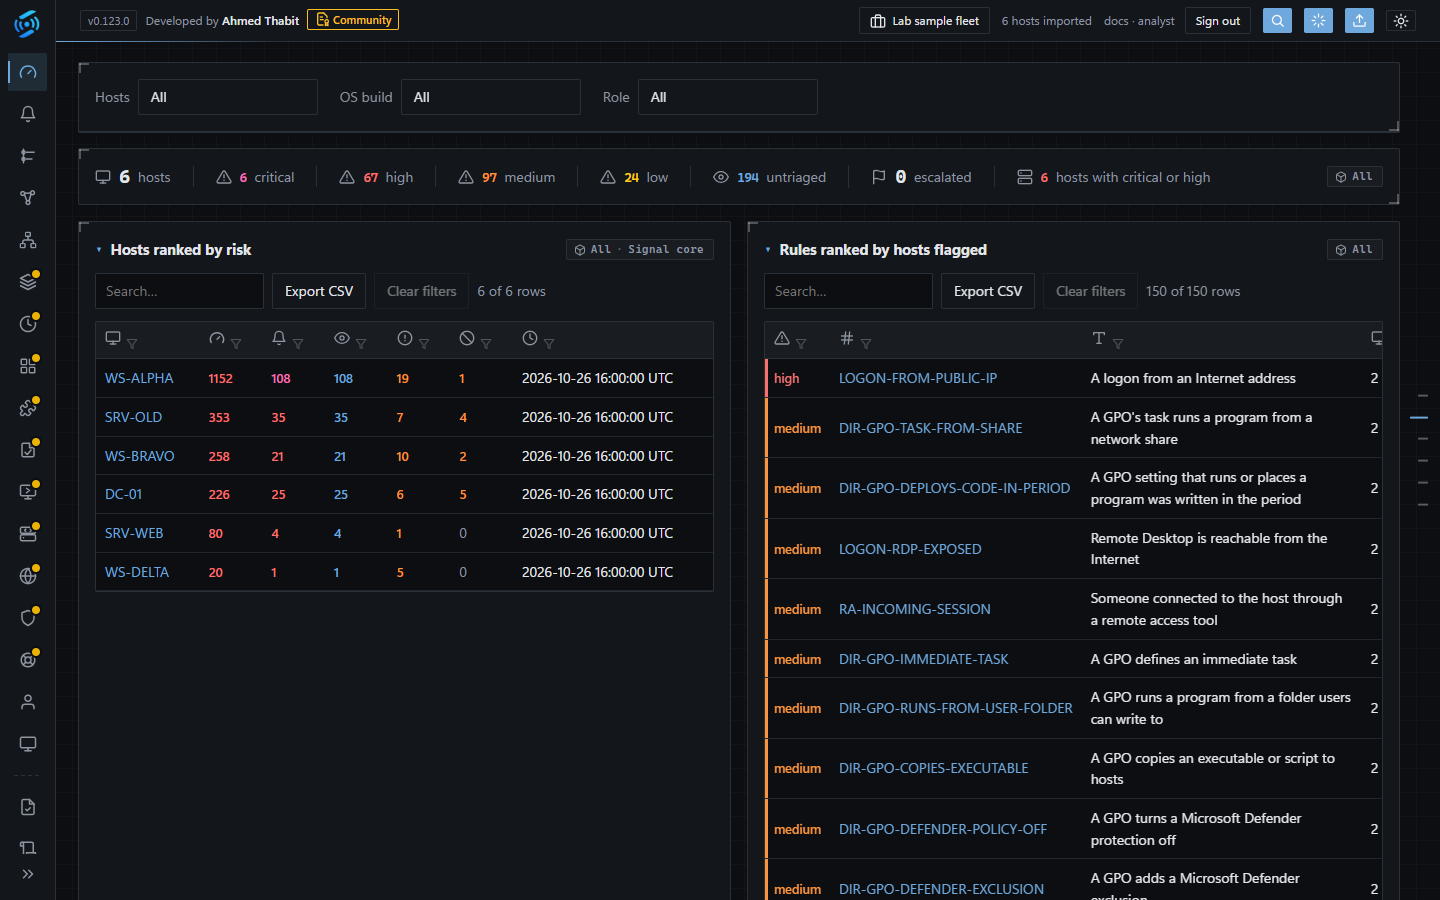
The Overview of the sample fleet: hosts ranked by risk, rules ranked by how many hosts they flagged.
The fleet dashboard: a summary strip (hosts, open signals by severity, untriaged and escalated signals), hosts ranked by risk, rules ranked by hosts flagged, telemetry coverage per category, collection freshness, and every item analysts flagged.
Risk is a host's open signals weighted by severity: critical 40, high 20, medium 5, low 1; an escalated signal counts twice; benign and suppressed count nothing.
Signals
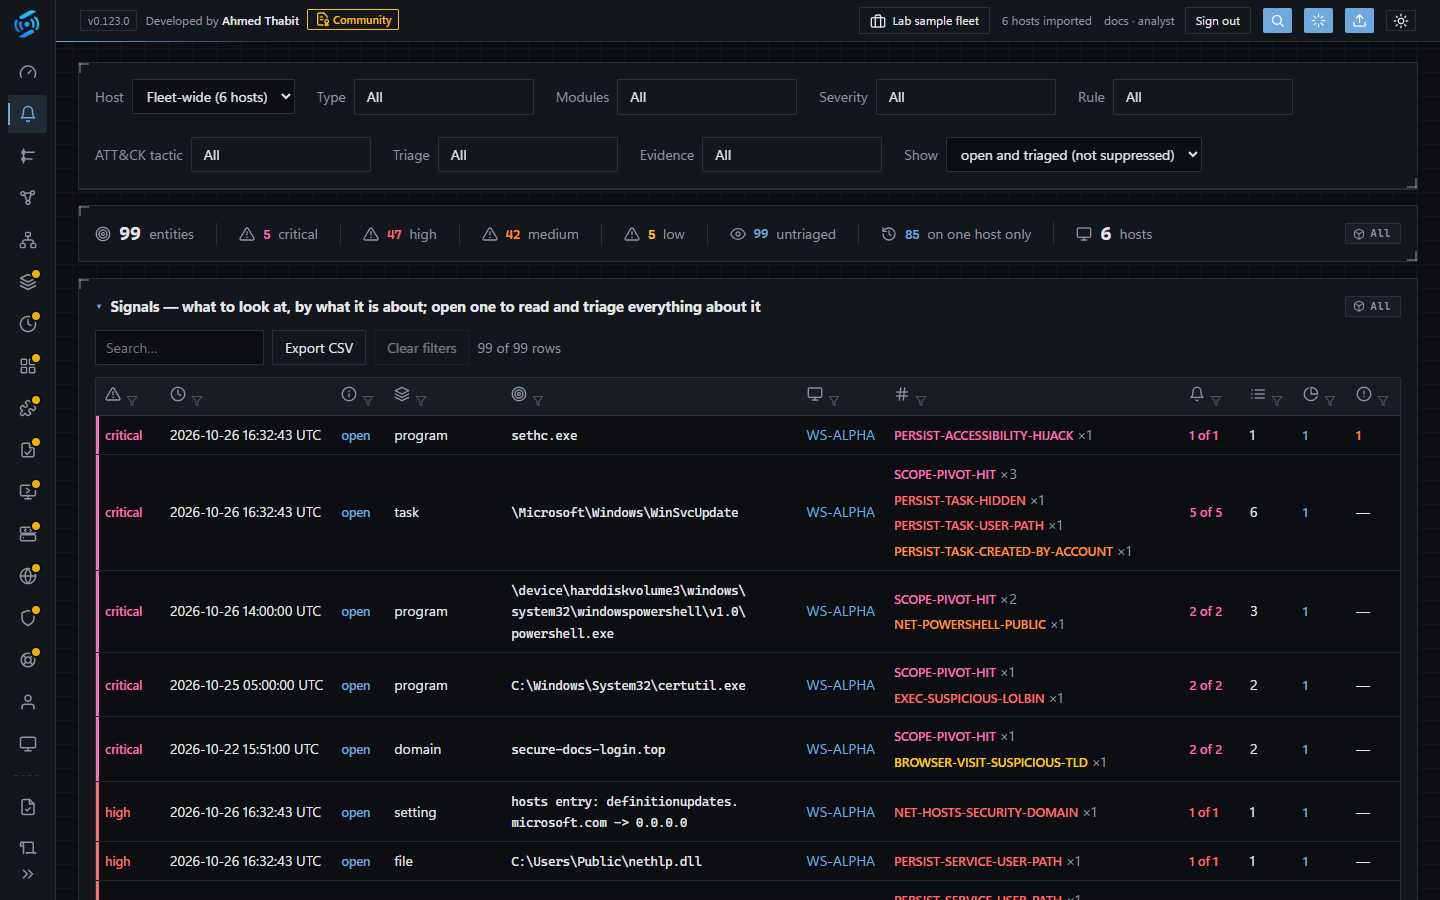
Signals: one row per thing to look at, with every rule that flagged it.
The list of what to look at: one row per entity on a host, with its signals by rule, its triage, how many hosts have it, and when it was last seen. Filter by host, type, module, severity, rule, ATT&CK tactic, triage and evidence; show only what is new since the previous collection, or only what one host has.
Opening a row opens the entity's page: everything about it on one page - its signals unfolding in place, its graph, its timeline, what Signal read about it, VirusTotal's stored answer when there is one, and its triage.
Timeline
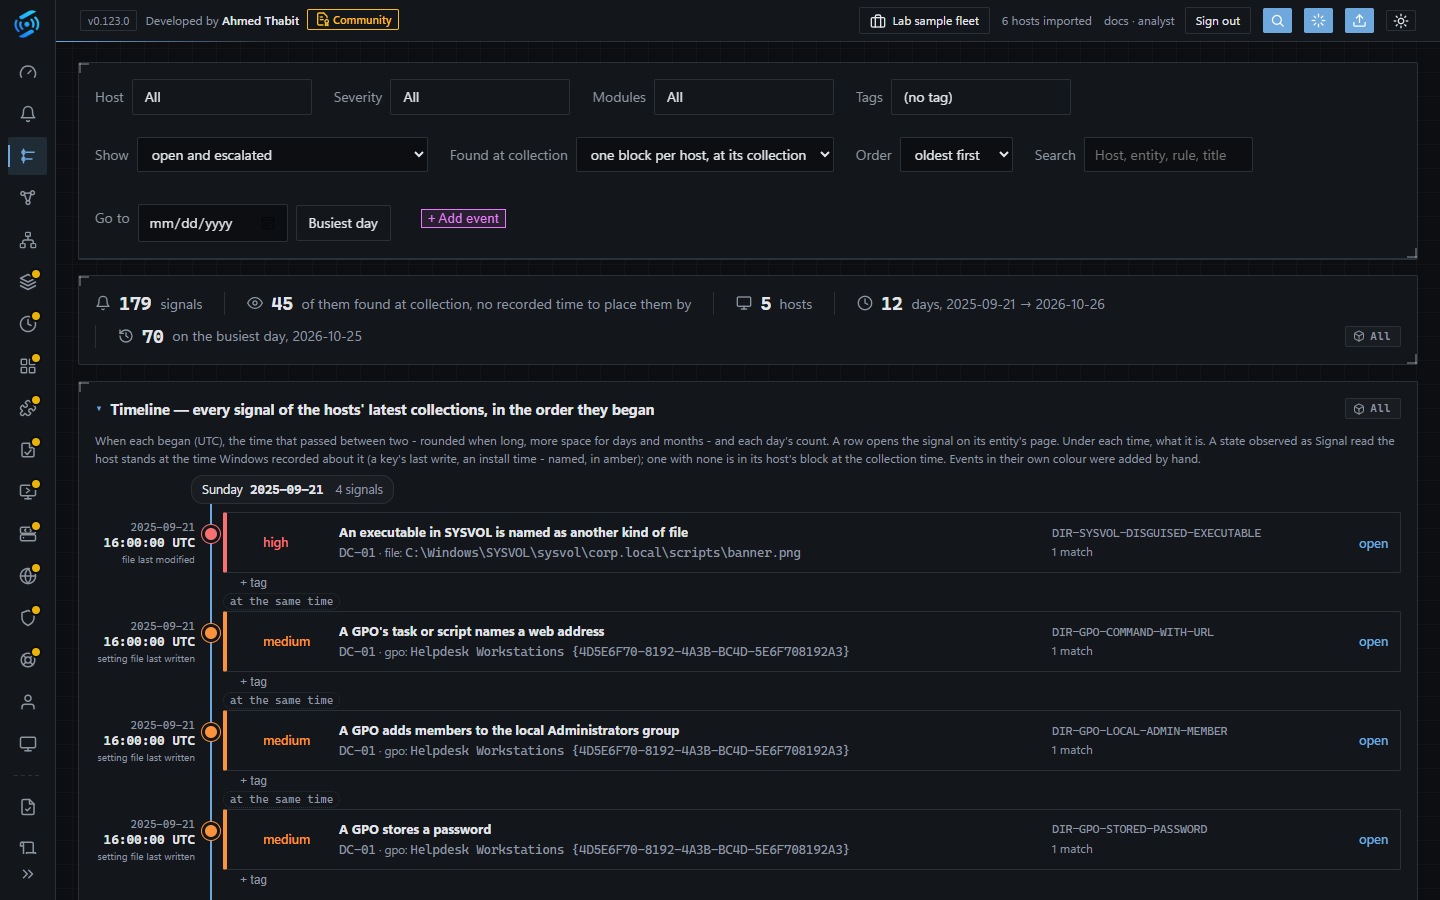
The timeline: every signal of the fleet in time order.
Every signal's occurrences in time, across hosts, in UTC. Add your own events and tags to build the incident's story.
Graph
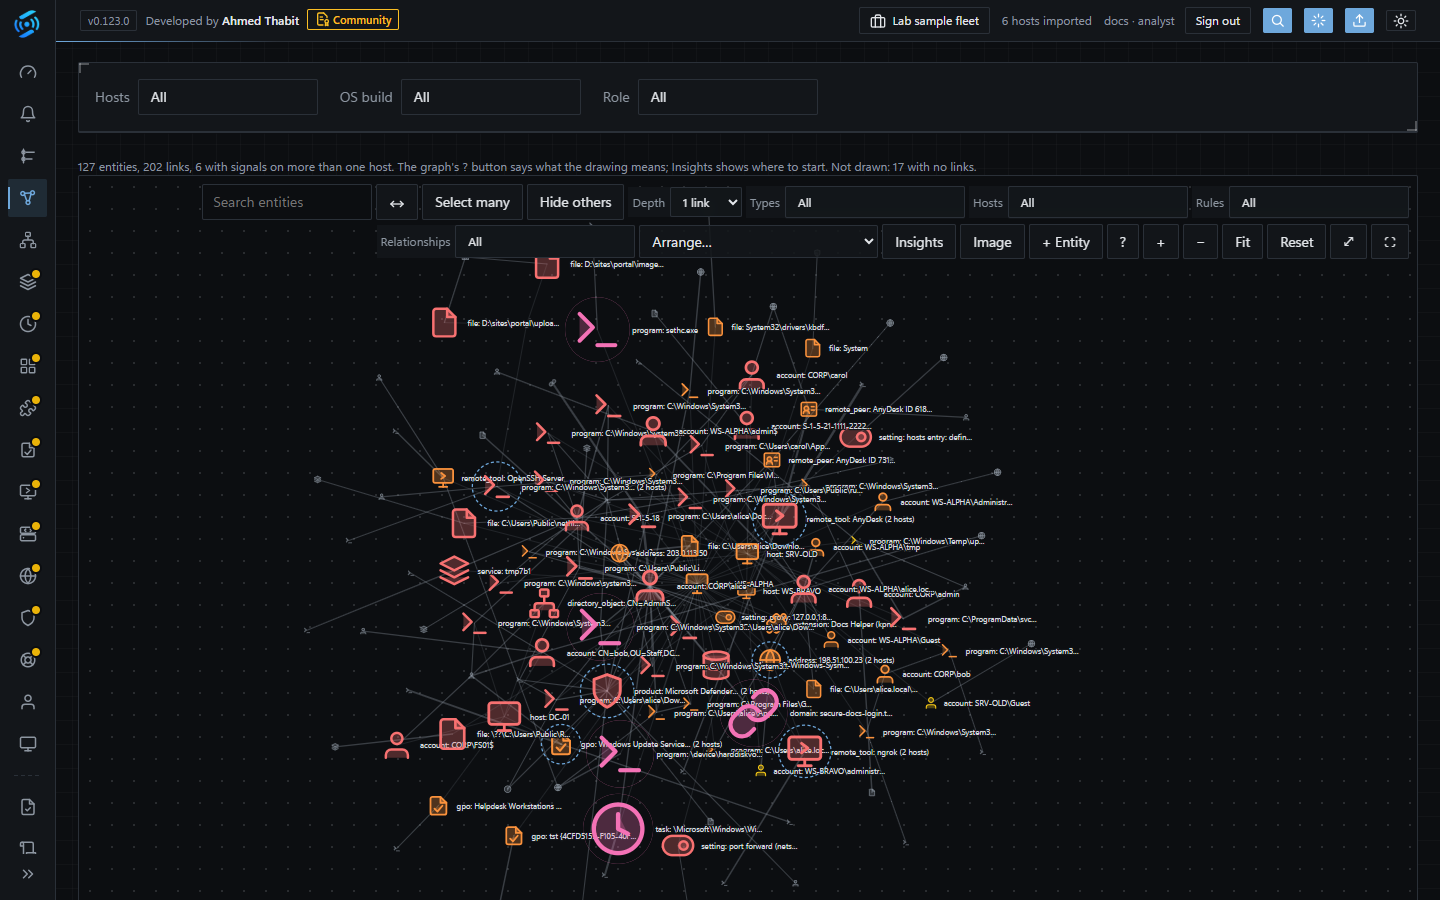
The graph: entities and how they are linked, across hosts.
The entities and how they are linked, across hosts: search, select, show only what is within a few links, find the shortest path between two entities, and add your own entities and links - always marked as yours, never Signal's.
Topology
The hosts and the addresses they talked to, from the Network module's adapters and connection tables.
The data pages
Page | Shows, across the fleet |
|---|---|
Audit Policy | Each host's audit settings, by layer. |
Autoruns | Every persistence entry, stacked: an entry on one host of many stands out. |
Applications | Installed software, stacked; applications in CISA's Known Exploited Vulnerabilities catalog flagged. |
Extensions | Browser extensions, stacked. |
Group Policy | GPOs and what they deploy. |
Remote Access | Remote access tools, sessions and Windows' own ways in. |
Web Servers | Sites and flagged scripts. |
Network | Listeners and addresses. |
Protection | Antivirus products, exclusions and Windows' protections. |
Recovery | Each host's ways back. |
Users | Every account across the fleet, one row each - a domain account is one user, by SID. |
Hosts | Each host's identity, collections, telemetry and history. |
Each data page can be marked reviewed per host; the report counts what was not.
About Signal itself
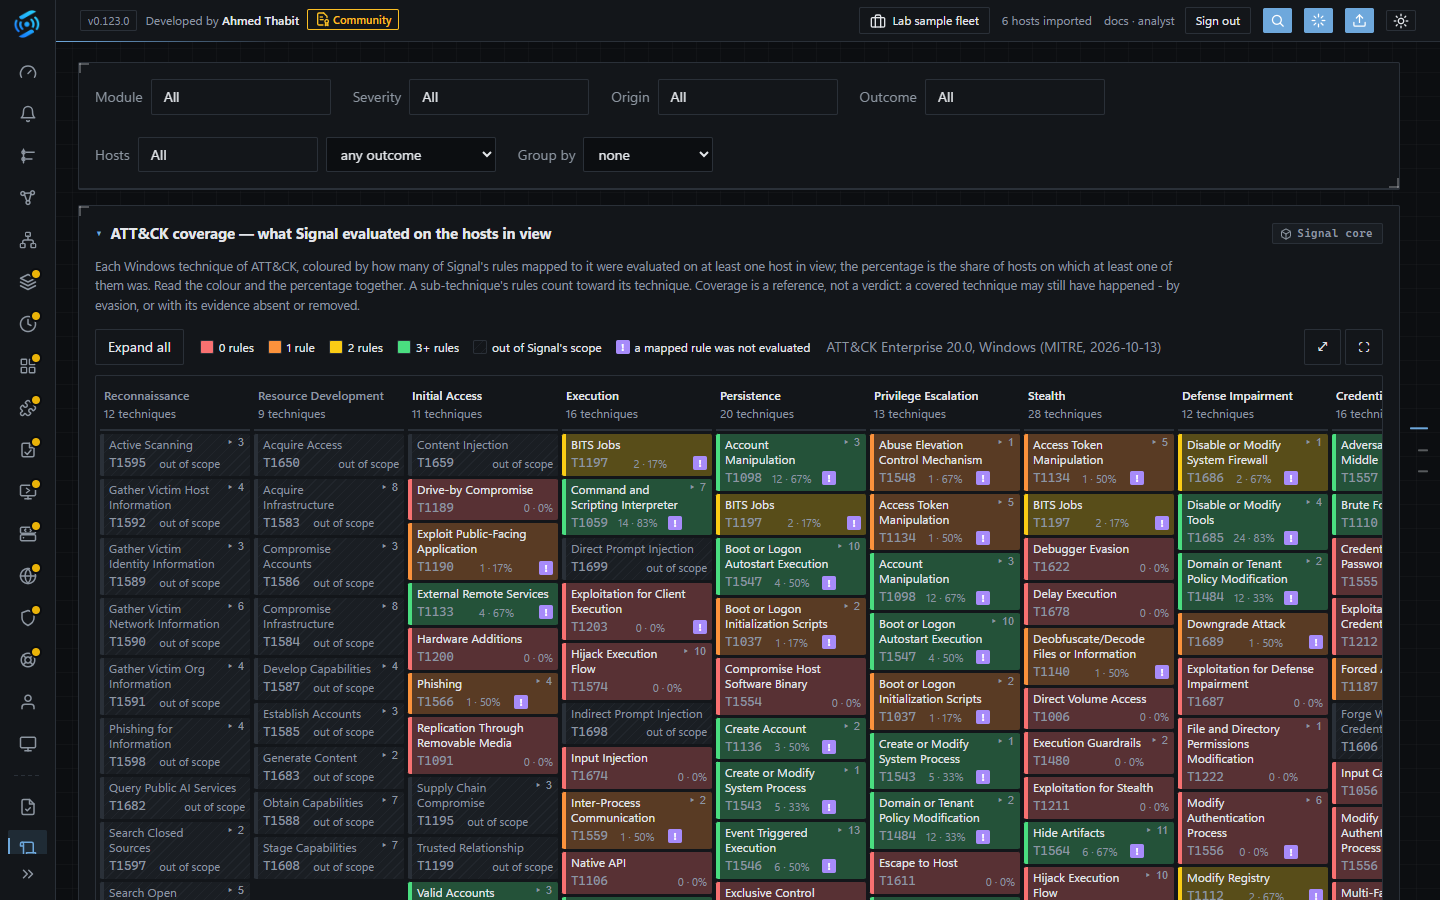
The Rules page: every rule, and whether it flagged, cleared or could not run on each host.
Page | Shows |
|---|---|
Reports | The compromise assessment report and every triage note. See Reports. |
Rules | Every rule the hosts ran - built-in and imported - with its logic, its outcome per host, and an ATT&CK matrix of what the rules cover. |
Modules | Every module: what it answers, the health of its evidence on each host, how it ran. |
Settings | Users, Updates, Audit log, HTTPS, server memory, VirusTotal, and the Profiles builder. |
License | The license, the notice and every third-party package. |